FLOW SYNTHESIS
In the absence of granular data on options (Put/Call Ratio) or over-the-counter transactions (Dark Pools), flow analysis focuses on price and volume dynamics. The recent decline occurred on moderate volumes (28% of the monthly average), which does not indicate capitulation or aggressive institutional selling pressure. The most salient point is AXA's notable outperformance compared to its benchmark index, the CAC 40 (+5.4 points over 20 days), signaling resilience and relative investor interest despite market weakness. The flow bias is therefore considered MIXED: macroeconomic selling pressure contained by microeconomic relative strength.
TECHNICAL AND VOLUMETRIC STRUCTURE
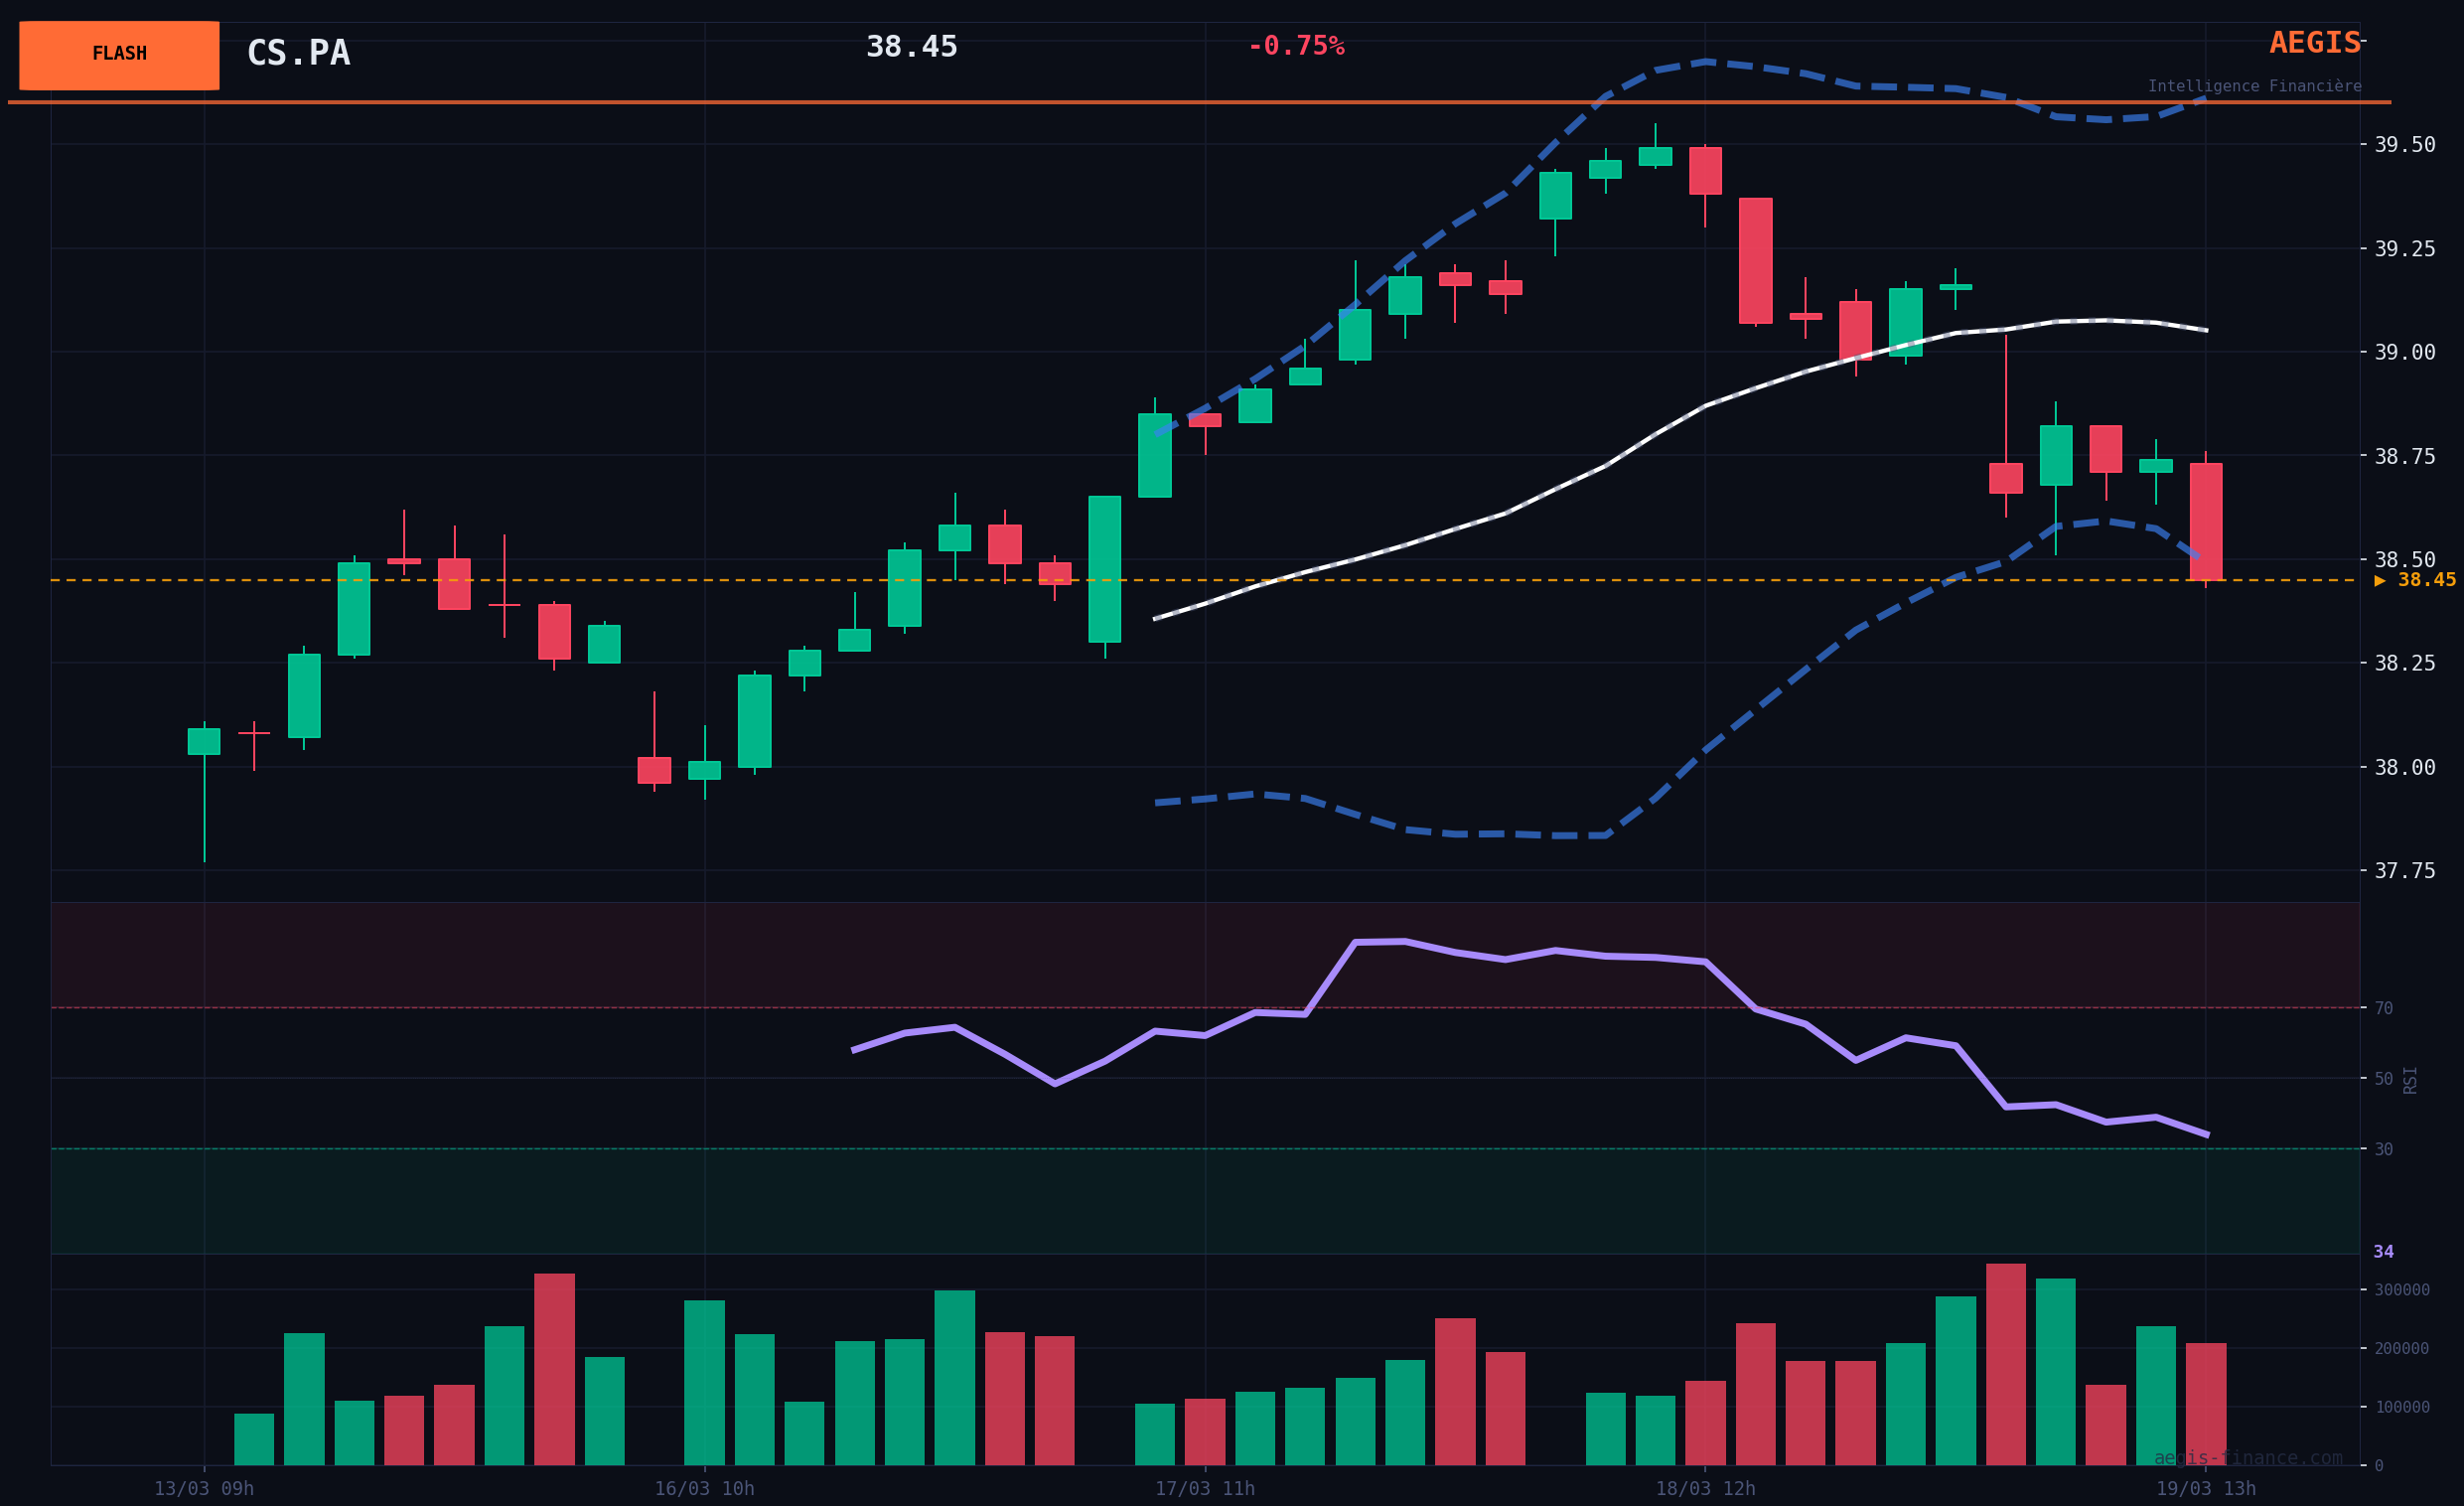
The AXA stock is evolving in a degraded short-term technical configuration, below its 20-day (39.08€) and 200-day (40.00€) moving averages. However, several elements call for caution before adopting a purely BEARISH bias. The RSI(14) momentum indicator is at 28.59, in oversold territory, which signals a potential exhaustion of selling pressure and opens the way for a technical rebound by returning to the average. The current price of 38.45€ is in the immediate vicinity of the major support identified at 37.09€. Holding this level is critical to avoid BEARISH acceleration.
SCENARIOS & CATALYSTS
- Base Scenario (Probability: 45%): The stock stabilizes and evolves in a range between the support at 37.09€ and the resistance of the 20-day moving average around 39.08€. The conflict between solid fundamentals (record results, recommendation upgrades) and an adverse market environment (high VIX, correction regime) neutralizes the forces at play.
- BEARISH Scenario (Probability: 35%): A further deterioration in market sentiment (VIX > 30, SPY below its MA200) leads to the breaking of the support at 37.09€. This technical event would trigger a new wave of selling, invalidating the outperformance thesis and aligning the stock with the general BEARISH trend.
- BULLISH Scenario (Probability: 20%): The support at 37.09€ holds firmly, the RSI exits its oversold zone, and the overall market stabilizes. Investors refocus on AXA's attractive valuation and positive results, initiating a rebound towards the 200-day moving average around 40.00€.
AEGIS VERDICT
In a CORRECTION regime (SPY below MA50) and a context of geopolitical tensions and high volatility (VIX > 25), any directional positioning is high risk. The signal on AXA is NEUTRAL, reflecting the dichotomy between an oversold technical structure and notable relative strength on the one hand, and powerful macroeconomic headwinds on the other. The preferred scenario is a stabilization phase above the key support at 37.09€. A break of this level would invalidate this view and signal a probable capitulation.